Facebook nuances language to handle conflict

What we’ve found is that language is so important for meeting people’s needs and providing them a product or experience that helps them express how they’re feeling. (Jake Brill)

With over a billion users, you’d expect Facebook to research and understand language better than most.

In this ABC Rado National interview – Is Facebook becoming more friendly? – Facebook Site Integrity Team product manager, Jake Brill describes how he collaborates with emotional intelligence experts to create tools for tackling online conflict amongst users. The system, called social resolution, is designed to help teenage users better communicate their feelings and handle conflicts between friends, should material be uploaded that a person might not agree with.

Jake is in Australia to present a talk on online social resolution tools atThe 6th Annual Congress on Family Law and Children’s Rightsthis week.


Don’t get mad, get data

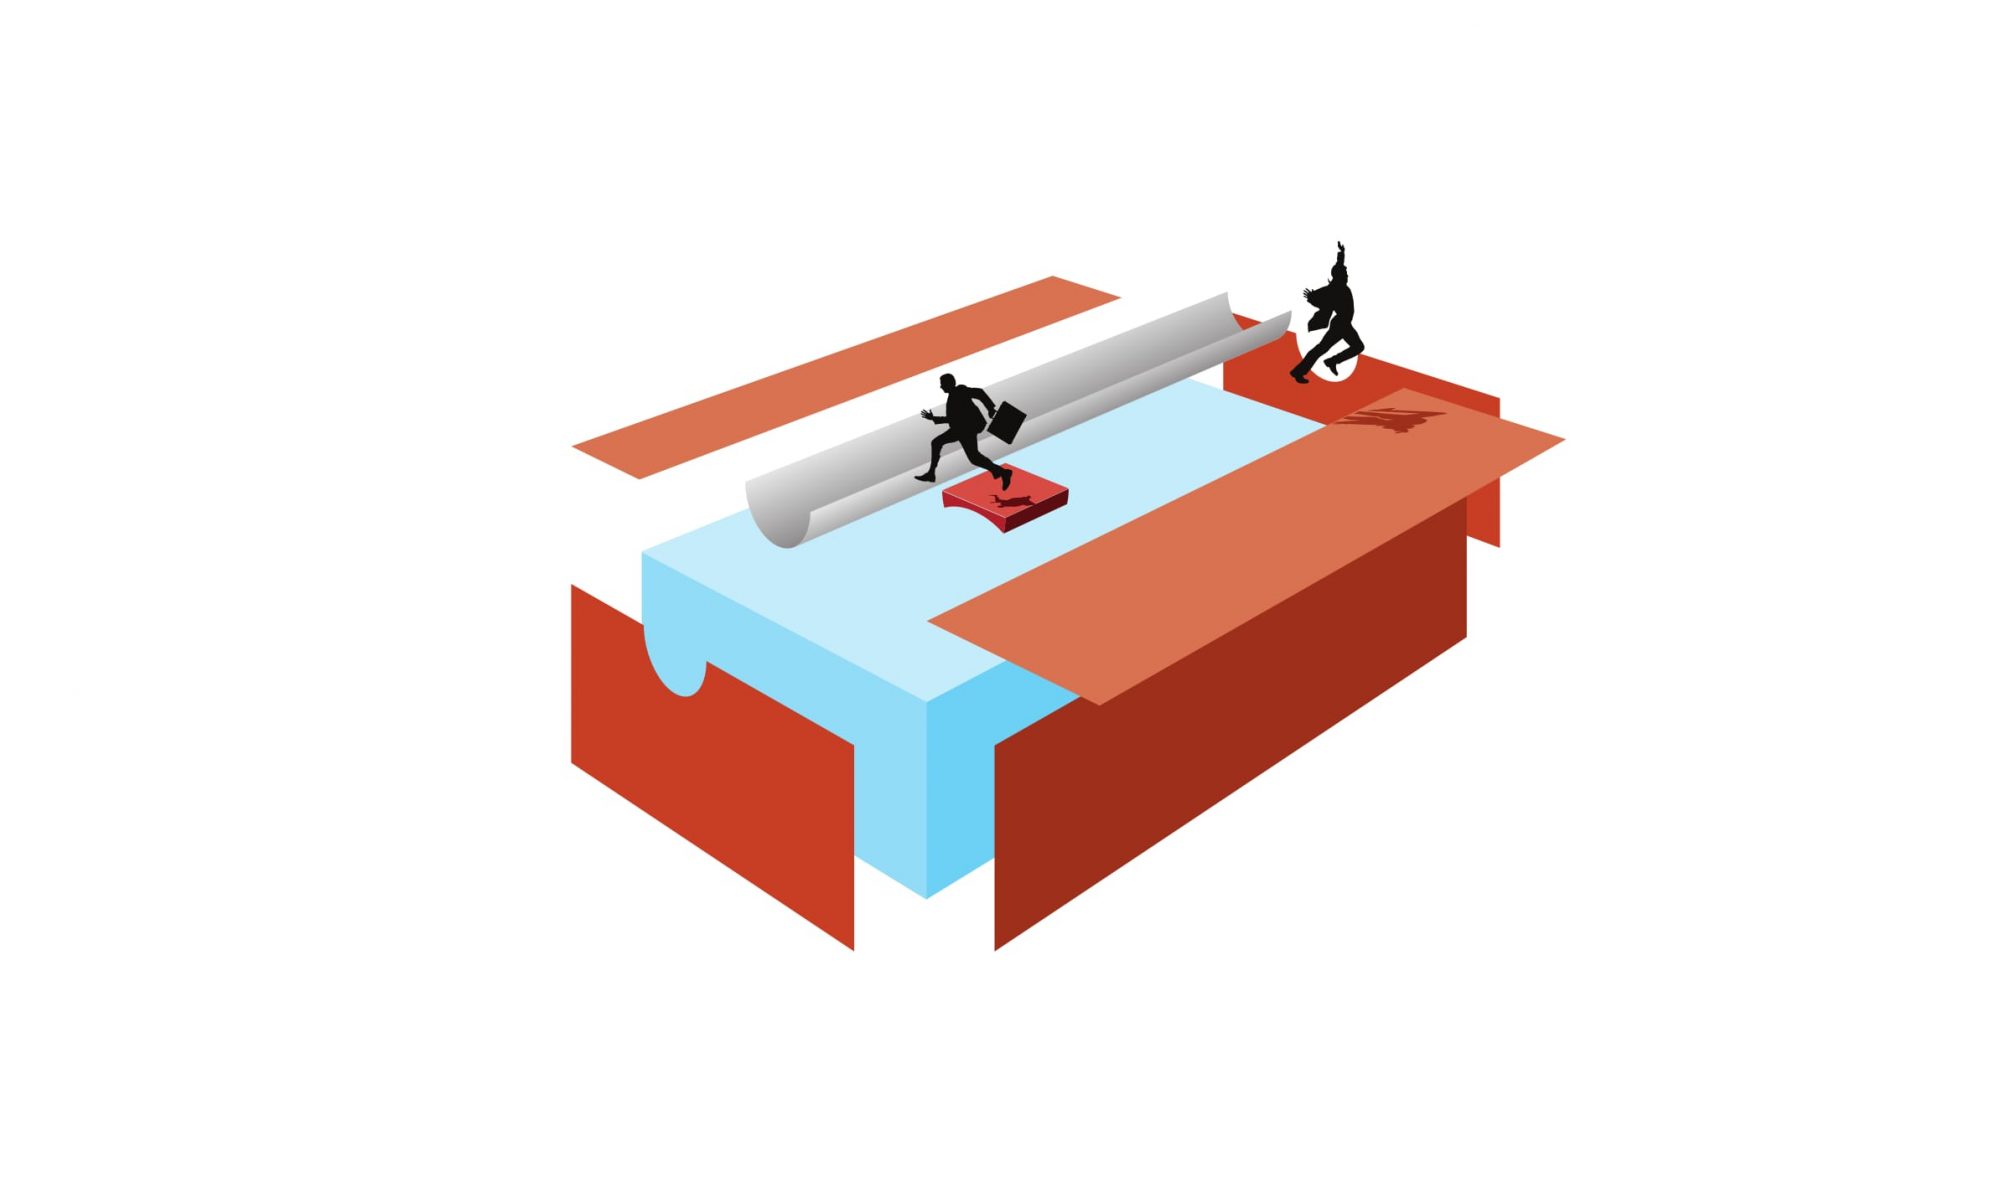
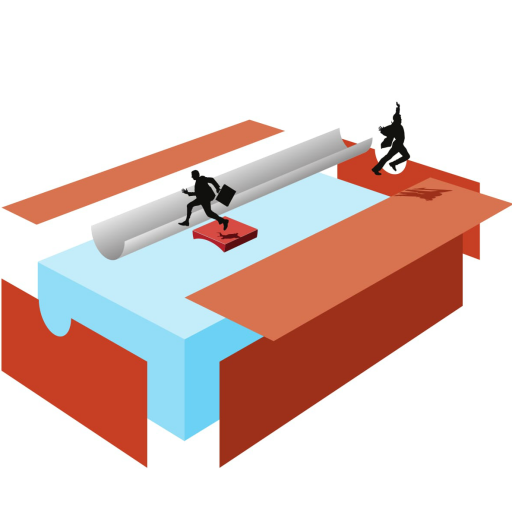
Has this happened to you? You create a design and someone – or a committee of someones – changes it. It doesn’t matter how you well you argue or justify your design. They just change it.

This happened to me last year when I was working pro bono on the content and information architecture for the website of Michael Olsen, a Melbourne-based playwright. I also helped Michael find a local WordPress developer who he then paid to build michaelolsen.com.au.

Now, people make changes to designs to suit themselves all the time. What’s wrong with that? And even though I wasn’t being paid, he was the client. Relax, it happens all the time. Right?

Well… Yes. And… No, damnit.

I’m right

You see, my designs were based on more than just me – my experiences and opinion. I used data. Unconventional I know. I’d tested the potential audience to discover what they were interested in. I’d run keyword searches to understand the language people use. (Factoid: the word ‘performances’ is more often used than ‘productions’ in searches related to theatre.) I’d conducted card sorting and tree testing activities. I’d run the results through the filter of my experience to produce the design.

And it wasn’t just that my design was difficult to build within the limitations of the software. Sure it was hard to specify exactly how visitors might find what they’re looking for from Michael’s more than 50 plays. But my research showed that people were very interested in the author, his news and his plays. This gave me the clue that site visitors – including potential directors and producers – would spend the time browsing the plays. They’re original plays for god’s sake; they’re interesting.

I was peeved

With all that up my sleeve how could I lose the argument? Well, they didn’t bother with the argument. They just changed it.

That’s when I decided to get data.

I had the top tasks, I had the live site and I had guinea pigs willing test subjects. According to my original study, these were the top five tasks:

  1. Check out the news: new plays, upcoming/recent performances, reviews
  2. About Michael
  3. Read synopses of plays
  4. Browse plays by… genre, number & gender of characters, number of acts, running time, etc.
  5. Who Michael has worked with: actors, directors, producers

So, as I was testing on another website, I just asked my test subjects to perform these tasks and watched them. Simple.

Results

The look and feel were found to be agreeable. “It’s light and simple,” said one. “I like the font and colours,” said another. Tick.

A general quiz showed the navigation and labels were OK. “It seems clear to me because when you mouse over those words a menu appears with the options I expect,” said one. Tick.

Task 1 Check out the news…:

In my original architecture I created a News tab and also linked clearly from the home page – describing what visitors were likely to expect when they clicked on News. I deliberately collapsed the ideas of Blog and News together for a number of reasons.

My test subjects were able to find News because of its prominence in the menu structure. The fact that it’s not often updated regularly (yet) is another matter and thankfully I kept News items off the homepage thinking that was the case. But there is now a Blog menu item which confused subjects for a while about News but… that’s a tick.

Task 2 About Michael:

This is a no brainer and my subjects found it pretty easily. Although one commented it was hidden further along the top horizontal menu than he expected which is not how I specified it. But… it was a minor change. Tick.

Task 3 Read synopses:

This is a straightforward alphabetical list of all the plays. It’s easy to find as Synopses A-Z is the only menu item under The Plays. I had broken up browsing A-K and L-Z, but A-Z was OK, just a bit more scrolling. Tick.

Task 4 Browse plays…:

This was the task subjects had the most problem with. None succeeded in being able to browse the plays by any of the categories. The original structure supported browsing for plays; replaced by a Search interface on the homepage. The relationship between search and navigation on websites is subtle and complex. Search is often used by people on the web but, as Jakob Nielsen writes in Converting Search into Navigation:

  • Most users are unable to solve even halfway complicated problems with search. Better to redirect their efforts into more supportive user interfaces when possible.

Furthermore, and somewhat paradoxically, search giant Google valorises web content. Google’s content and design guidelines recommend creating:

  • a clear hierarchy and text links with every page reachable from at least one static text link
  • a useful, information-rich site, and write pages that clearly and accurately describe your content

Hence my focus on making the categories browseable. It’s also what subjects stated they wanted when pressed – the Search interface is confusing due to the system of tagging the plays with the number and gender of characters. My system was much simpler and would have been searchable, too. It involved being much more general about the number and gender of characters so they could be browseable on a single page. This tested well on the tree testing I did initially and this was the case in practice. No tick.

Task 5 Who Michael has worked with…:

Subjects had no chance as this menu item and this information just didn’t make it to the final cut. No tick.

So the scorecard isn’t too bad – some good general comments, 2 straightforward ticks, a qualified 1 and 2 fails on the 5 top tasks. Not surprising since it’s a pretty simple website. Frankly, I was surprised by the data.

Data is better for blood pressure

Is this article equivalent to a building architect delivering drawings and then whingeing about the client and builder when things are changed? Maybe. There’s no doubt there’s a strong family resemblance between building and information architecture.

But also differences:

  • It’s hard to change a building once it’s built; with the right software, websites lend themselves to small incremental improvements.
  • It’s also easier to observe website behaviour. Between the surveying, card sorting, wireframes, tree testing, analytics, search data and user observation we do, it’s much easier to understand how visitors will use a website than use a building. Note: this is changing – mocking up rooms to understand how people use them is gaining momentum (see New York Times article Factory Efficiency Comes to the Hospital).

Understanding website usage and “getting your hands dirty” with the data is worth sticking up for. I recommend data over anger if only for two reasons:

  1. you learn a hell of a lot more by being objective about it
  2. it’s better for blood pressure

Data can surprise us. We already know our opinions – by definition – there are no surprises there. An opinion’s sample size is one. Go for data, become your own scientist and experiment, experiment, experiment.

On cows and web FAQs: 3 thought experiments

Imagination is more important than knowledge – Albert Einstein

Thought experiment 1: infrequently asked questions FAQs

Imagine you’re in a viewing room above a dairy watching afternoon milking time. A few questions pop into your mind: How often are the cows milked? How long does it take to milk?

A nearby poster – Frequently Asked Questions (FAQs) – attracts your attention. The questions on the poster include: What’s the volume flow of the milk being pumped? What brand are the suction attachments? How often is the plant equipment upgraded? 

None of these questions are the ones that sprang to your mind. How do you feel?

Thought experiment 2: the ‘all question’ dump FAQs

Again, imagine you’re at the dairy watching the milking process and pondering some simple questions such as: How long does it take to milk all the cows and What happens to the milk? 

You see a door marked with the label: FAQs. You open the door and enter the room. On the walls are 10 posters all composed of questions and answers on general farming topics. Your topic might be there but you only have 20 seconds before you have to leave.

How’s that working for you?

Thought experiment 3: unrelated FAQs

Milking time and those bothersome questions again. This time you’re attracted to an FAQs poster. This time it has information about the menu at the Cafe next door like How much is a caffe latte? and  Who is the CEO of the Cafe?

Blood boiling yet?

These FAQs blunders happen on the web all the time

Absurd exercises or have you had similar experiences on the web? These are common errors seen on websites we’ve all visited:

  1. Infrequently asked questions FAQs: questions that are just plain made-up (and often too technical) to fit the question and answer format
  2. The ‘all questions’ dump FAQs: when you click on the FAQs menu item you get all possible questions lumped together in one long page – how do I know my question has been very frequently asked?
  3. Unrelated FAQs: questions and answers that don’t directly apply to the information you’re currently looking at

Milking time at Caldermeade Farm and Cafe

OK, so you’ve got this far so you deserve to see the sign that prompted me to think about all this: it’s a physical FAQs sign at the milking viewing room at Caldermeade Farm and Cafe:

FAQs sign: 1. How often are the cows milked? Twice a day - 4.30am and 3.30pm. 2. How long does it take to milk? 400 cows are milked by 2 operators in approximately 1 hour 40 mins. 3. How many cows can fit on the milking platform? 50 cows. 4. How long does it take a platform (with 50 cows) to rotate? 10 mins.

 It’s brilliant because the language and format are so simple, it quickly answered all the questions I had in mind and improved my experience.

Do your website FAQs like Caldermeade Farm

  • Make sure your questions are frequently asked: this sounds so logical that it seems inconceivable that it could be ignored. It’s obvious that someone at Caldermeade over the years has taken the trouble to listen to the questions and write them down in frequency order.
  • Don’t lump all of your questions and answers at the end of a click: As Gerry McGovern writes: “Links are signposts. They are promises to the customer. They must tell customers where they are going and what they will get when they get there. The essential problem with FAQs is that it is not useful or helpful.” I agree with Gerry: the label FAQs is misleading navigation. Instead…
  • Relate your FAQs to the content on the page people are likely to have questions about.
  • Keep your questions and answers focused and short: one of the problems with FAQs as an informational format is that the first few words are taken up with question words – what, how, why. If you must use FAQs (they can be useful and helpful if they adhere to the 3 first points)  keep the questions and answers short so people can scan quickly to the keywords they’re looking for.
  • If you don’t have a mechanism for collecting frequently asked questions then get one! Ask any customer facing people in your organisation about the topics they regularly get enquiries about. Last night I wanted to find out about kids birthday parties at a swimming pool complex. Their webpage listed all details apart from the price. Like 99% of people who ended up on that page, we just needed an indication of price. I had to ring up and ask. Surely that’s an FAQ but I bet the person I spoke to on the phone hasn’t passed that on to the web author.

The great thing about the Caldermeade FAQs is that Caldermeade management is so confident these are the right questions and answers that they’ve printed them on a board. Not so good if they need to change them. That’s the advantage of the web. Find out something is trending as an FAQ… just update the page.

New universal symbol for communication access

The Communication Access symbol is good thinking. Disability services organisation, Scope led the development of the new Communication Access symbol (see right) which lets you recognise businesses and facilities providing access for people with a disability.

You get the right to display the Communication Access symbol by completing a Communication Accessibility Assessment and by being ready to work with people with communication disabilities.

I believe the symbol is an important aid to communication for two reasons: one is practical (for people with a communication disability) and another is ethical(for everybody).

The practical reason is simple. Businesses and services connect quickly and easily with people with special communication needs. It saves time, energy and money. It builds trust. It also sets the standard and, let’s assume for the moment, best practice for public interaction and support for disabled communicators.

(I’m looking forward to more detail on how it will be applied to web communications.)

Everybody’s problem

The ethical reason is an issue for us all. Stated simply:

Unless we understand each other, and understand each other as comprehensible, we won’t treat each other with the proper respect.

We’ll only solve our communication problems if we see them as human problems in the context of a particular situation – disability.

We can’t solve these problems if we see them as merely “disability problems”; they come about when we see “them” (disabled communicators) as being somehow unlike “us” (able communicators). It’s sloppy thinking and it’s not good enough.

The Communication Access symbol is one step in addressing everybody’s communication problems.

What hospitals, airports & cities can learn from websites

Three authors from such diverse professions as healthcare and urban design draw on ideas that have been closely associated with, and further developed in, the field of website design: service design, usability, user experience and human-centred design.

Customer experience in hospital

What would hospitals be like if they were run by Disney? This fascinating thought experiment has occupied the mind of Fred Lee, a former hospital executive who consulted on healthcare with Disney. In this ABC podcast interview external link icon Fred explains Disney’s view on customer experience (the experiences a customer has with goods or services providers). And here’s more about his book, If Disney Ran Your Hospital: 9 ½ Things You Would Do Differently external link icon.

Usability saves time at airports

 Last year over five billion people travelled by air, each one of these people arrived at the airport and made their way through the necessary stages of waiting; check-in, security, customs, boarding. On average, each passenger will have spent 42 minutes doing nothing but waiting. Not eating or reading or relaxing, just waiting.

Think about how much better the world would be if we could save just 3 minutes of waiting at airports. Find out how PhD student Anna Harrison uses ideas on human-centred design to analyse and redefine existing approaches to check-in and boarding: Airports – where you go to wait external link icon.

Urban design as service design

How did the data on cholera in 19th century London affect the design of its infrastructure? These days masses of phone data are collected as we move through urban environments. How can this be used to design better cities?
In this ABC interview external link icon, Urban Infomatics Design Lead at Arup Michelle Tabet  explains how data is being used to design successful urban projects. Find out more about Michelle’s design ideas: Urban design is service design external link icon.